
Turning Data into Decision-Ready Business Insight
Data Visualization with BI for Clear, Actionable Business Insights
Data has value only when it supports clear, timely decisions. Many organizations accumulate significant volumes of operational and transactional data, yet still rely on manual reports, disconnected spreadsheets, and incomplete visibility when it matters most. The gap between data collection and decision-ready insight is where business performance is lost. By the time figures are reconciled, exported, and circulated, the moment to act has often passed.
 NDA ProtectedClient-Owned IPEnterprise ArchitectureNDA ProtectedClient-Owned IPEnterprise ArchitectureNDA ProtectedClient-Owned IPEnterprise Architecture

Designed for business and analytics leaders who need reliable, decision-ready insights from data-without manual reporting overhead.

Challenges Businesses Face with Data & Reporting
Most organizations are not short of data. What they lack is the ability to use it reliably when decisions need to be made.
Fragmented Data Across Disconnected Systems
Data spread across ERP platforms, CRM tools, financial applications, and operational databases creates reconciliation overhead rather than insight. Reporting becomes manual, error-prone, and dependent on individuals rather than systems.
Lack of Real-Time Visibility
Without real-time visibility into KPIs and performance trends, shifts in operational health go undetected until they have already affected outcomes. Static reports reflecting last week's position do not support decisions that need to be made today.
Eroded Decision Confidence
When the data underlying a report is unclear, inconsistent, or disputed, decisions are delayed or made on assumptions rather than evidence. Over time, this erodes confidence in reporting altogether - and with it, the organization's ability to allocate resources effectively or identify opportunities before they pass. These are not technology failures. They are business risk factors that compound as operations scale.
Our Data Visualization & Business Intelligence Services
Effective BI is not about producing more reports. It is about ensuring the right people have access to accurate, relevant information at the point where decisions are made.
Dashboard and Report Development
We design interfaces around how teams use information - not around what is technically convenient to present. This requires understanding workflows, identifying what questions need answering, and structuring visualizations that surface insight without requiring interpretation.
KPI Tracking and Performance Metrics
We work with leadership and operations teams to define measurable indicators that reflect operational health and strategic progress. Those indicators are consistently tracked, validated for accuracy, and visible in real time - not buried in monthly exports.
Data Integration and Unified Reporting
Where data resides across multiple systems, we design integration architectures that create a single, unified reporting layer. The objective is consolidated understanding - ensuring patterns, risks, and performance signals are visible without reconciliation overhead.
Data Quality and Validation
Validation protocols, data lineage tracking, and audit trails confirm that what is being reported matches operational reality. When data integrity is compromised, decision-makers know why and what adjustments are needed - rather than discovering discrepancies after acting on flawed information.
Ongoing Dashboard Optimisation
Reporting structures are reviewed against actual usage, redundant views are eliminated, and new metrics are incorporated as operational priorities shift. Dashboards remain accurate and adopted - not static artefacts that stop reflecting how the business actually operates.

For teams requiring dedicated BI development capacity, we also offer the option to Hire Power BI Developers who work as an extension of your analytics team.
When to Choose Data Visualization & BI Services
When BI Becomes a Strategic Business Requirement
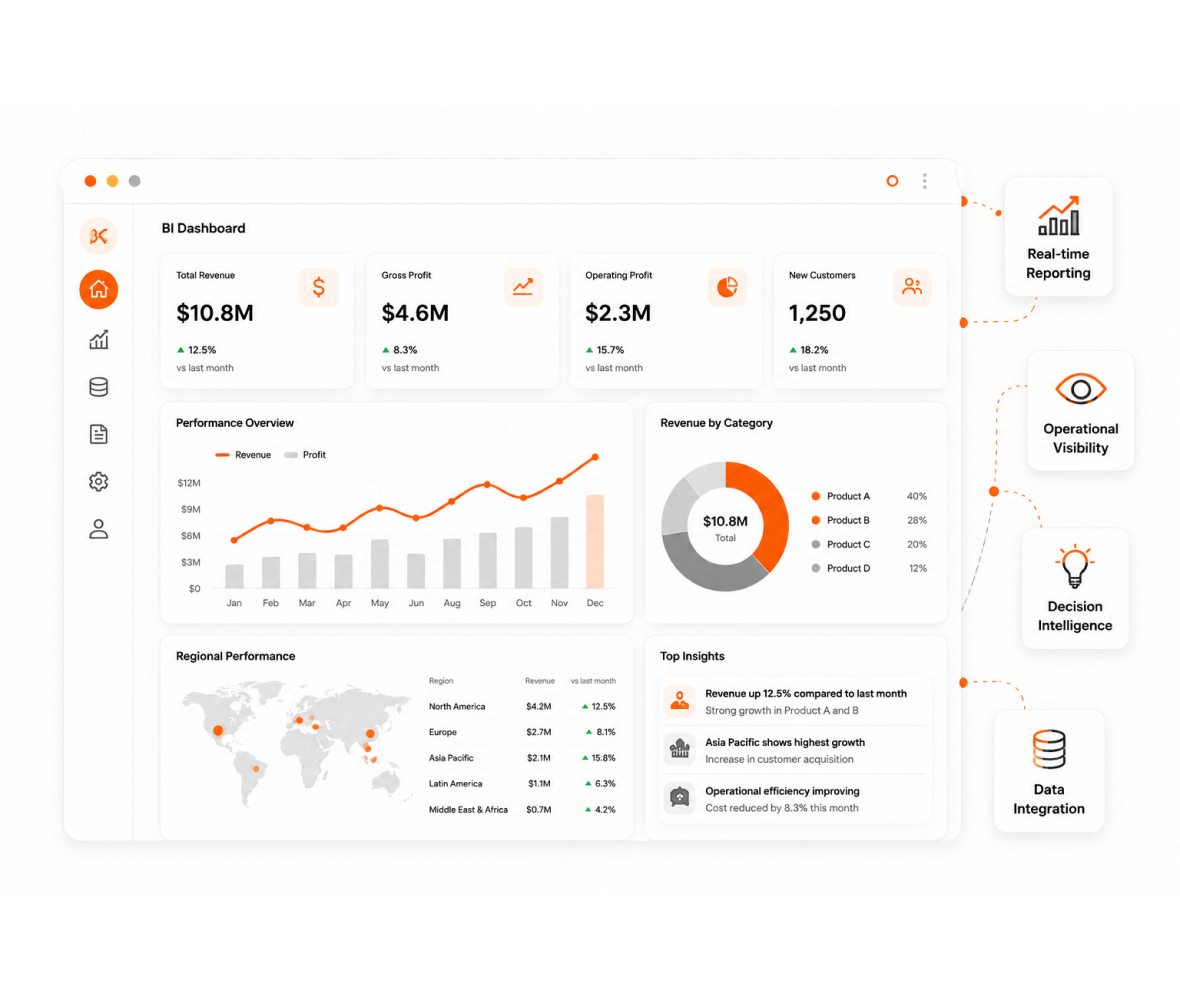
BI investment is the correct path when your organisation's decision-making is constrained by fragmented data, manual reporting processes, or a lack of real-time visibility into operational performance. It is the right choice when leadership needs reliable, consistent metrics to make timely decisions - and when the cost of delayed or inaccurate reporting is already affecting outcomes.
When BI May Introduce Unnecessary Complexity
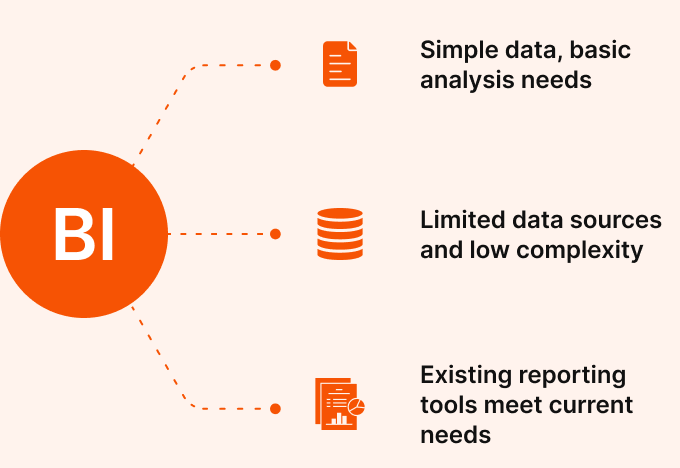
BI is not the right investment when data volumes are small, reporting needs are straightforward, and existing tools already provide sufficient visibility. If a well-configured spreadsheet or a standard reporting feature within your existing platform meets current needs without material limitations, additional BI infrastructure may represent unnecessary complexity.
Consulting-Led BI Delivery Approach
BI initiatives underdeliver most often because reporting systems are designed around available data rather than required decisions.
Business Goal Discovery
We start by understanding what decisions depend on data, who makes those decisions, and what information gaps currently prevent confidence. This shapes the architecture and establishes what success looks like before any dashboard is designed.
Data Modeling and Integration Planning
We map how data flows between systems, identify transformations required for consistency, and design the underlying structure that supports accurate reporting across time periods, departments, and operational contexts. This may also include enabling AI-driven insights such as predictive analytics, anomaly detection, or automated trend identification within reporting systems.
Dashboard and Workflow Design
Interfaces are built to reflect how teams work - prioritizing clarity over visual complexity and ensuring critical information is always visible without excessive navigation or filtering.
Validation and Adoption Support
We test for accuracy, train users on effective dashboard interpretation, and confirm that reporting processes integrate into operational routines rather than becoming supplementary work that gets ignored when things get busy.
Business Goal Discovery
We start by understanding what decisions depend on data, who makes those decisions, and what information gaps currently prevent confidence. This shapes the architecture and establishes what success looks like before any dashboard is designed.
Data Modeling and Integration Planning
We map how data flows between systems, identify transformations required for consistency, and design the underlying structure that supports accurate reporting across time periods, departments, and operational contexts. This may also include enabling AI-driven insights such as predictive analytics, anomaly detection, or automated trend identification within reporting systems.
Dashboard and Workflow Design
Interfaces are built to reflect how teams work - prioritizing clarity over visual complexity and ensuring critical information is always visible without excessive navigation or filtering.
Validation and Adoption Support
We test for accuracy, train users on effective dashboard interpretation, and confirm that reporting processes integrate into operational routines rather than becoming supplementary work that gets ignored when things get busy.


Engagement Models We Offer
BI and reporting requirements vary in complexity, urgency, and ongoing support needs. We structure engagements to reflect how organizations plan and deliver analytics initiatives.

Dedicated BI Developers
For projects with evolving requirements that cannot be fully defined upfront, dedicated BI developers provide the continuity and data domain knowledge that rotating teams cannot. This model is the right fit when dashboards require ongoing refinement, new integrations are introduced regularly, and the reporting environment needs to evolve alongside the business. Developers operate as an extension of your analytics team, building context over time that directly improves reporting accuracy and delivery speed.

Project-Based Development
When scope is clearly defined, timelines are fixed, and the objective is a specific dashboard build, data source integration, or reporting modernisation effort, project-based development delivers predictable outcomes against agreed milestones. This model works when requirements are bounded, the deliverable is specific, and the team does not need ongoing BI support beyond the project.

Consulting & Advisory Engagement
When the reporting landscape is unclear, or when teams need to evaluate current analytics capabilities before committing development resources, a consulting engagement provides the evaluation framework to make that call with confidence. This model covers data quality assessment, BI strategy definition, and analytics infrastructure planning - helping organisations avoid committing to a platform or approach before the data landscape justifies it.

Flexible Engagement Approach
Not every analytics initiative follows a predictable arc. An initial dashboard build may reveal requirements for deeper data integration, or a consulting assessment may lead directly into implementation. We structure engagements to accommodate that progression without requiring new vendor relationships, knowledge transfer, or re-onboarding - allowing teams to move between delivery models without losing momentum or analytical context.
Technologies and Platforms We Use
We work with enterprise-grade BI platforms, data warehousing solutions, and visualization tools selected based on organizational requirements, existing technology investments, and scalability considerations.

BI Platform and Visualization Tools
Power BI, Tableau, Looker, Metabase, and D3.js form the core of our visualization layer - selected based on the reporting complexity, user access patterns, and integration constraints of each engagement. Power BI suits organisations already invested in the Microsoft ecosystem. Tableau and Looker serve environments where data exploration and self-service analytics take priority. Metabase works well for leaner reporting setups. D3.js is used where fully custom, interactive data visualisations are required beyond what standard BI platforms support natively.

Data Platform and Cloud Infrastructure
We work across Azure, AWS, and GCP depending on where your data already lives and how your infrastructure is managed. Each platform introduces different pipeline tooling, permission models, and native integration paths - and our architecture decisions reflect those differences rather than defaulting to a single preferred stack.

Storage and Data Warehouse
Underlying storage choices depend on volume, query patterns, and how data needs to flow into the reporting layer. We work with PostgreSQL, Oracle, and MongoDB for relational and document-based source systems, and with Snowflake and Azure Data Lake where analytical scale and centralised warehousing are required. Storage architecture is designed around how reporting queries will actually run - not just what is available at the point of setup.

Why Choose NebulaTech for Data Visualization & BI
Our consulting-first delivery approach ensures BI systems serve decision-making rather than technical convenience. We begin by understanding what choices require data support, then design reporting environments that align with how your organization operates.
The difference is not in development capability alone, but in how decisions are structured before development begins.
NDA-First Engagement and Client Ownership


NDA-first engagement protects proprietary business logic, operational strategies, and competitive insights embedded in reporting requirements. All dashboards, data models, and integration architectures are fully owned by the client.
Data Governance Built In
Architectures for Long- Term Viability
NDA-First Engagement
and Client Ownership
Data Governance Built In
Architectures for Long-
Term Viability
NDA-first engagement protects proprietary business logic, operational strategies, and competitive insights embedded in reporting requirements. All dashboards, data models, and integration architectures are fully owned by the client.
What we deliver is not visual output alone. It is decision-ready information - structured, validated, and aligned to how your organization operates.
Cost of Data Visualization & BI Services
What Determines Data Visualization and BI Cost
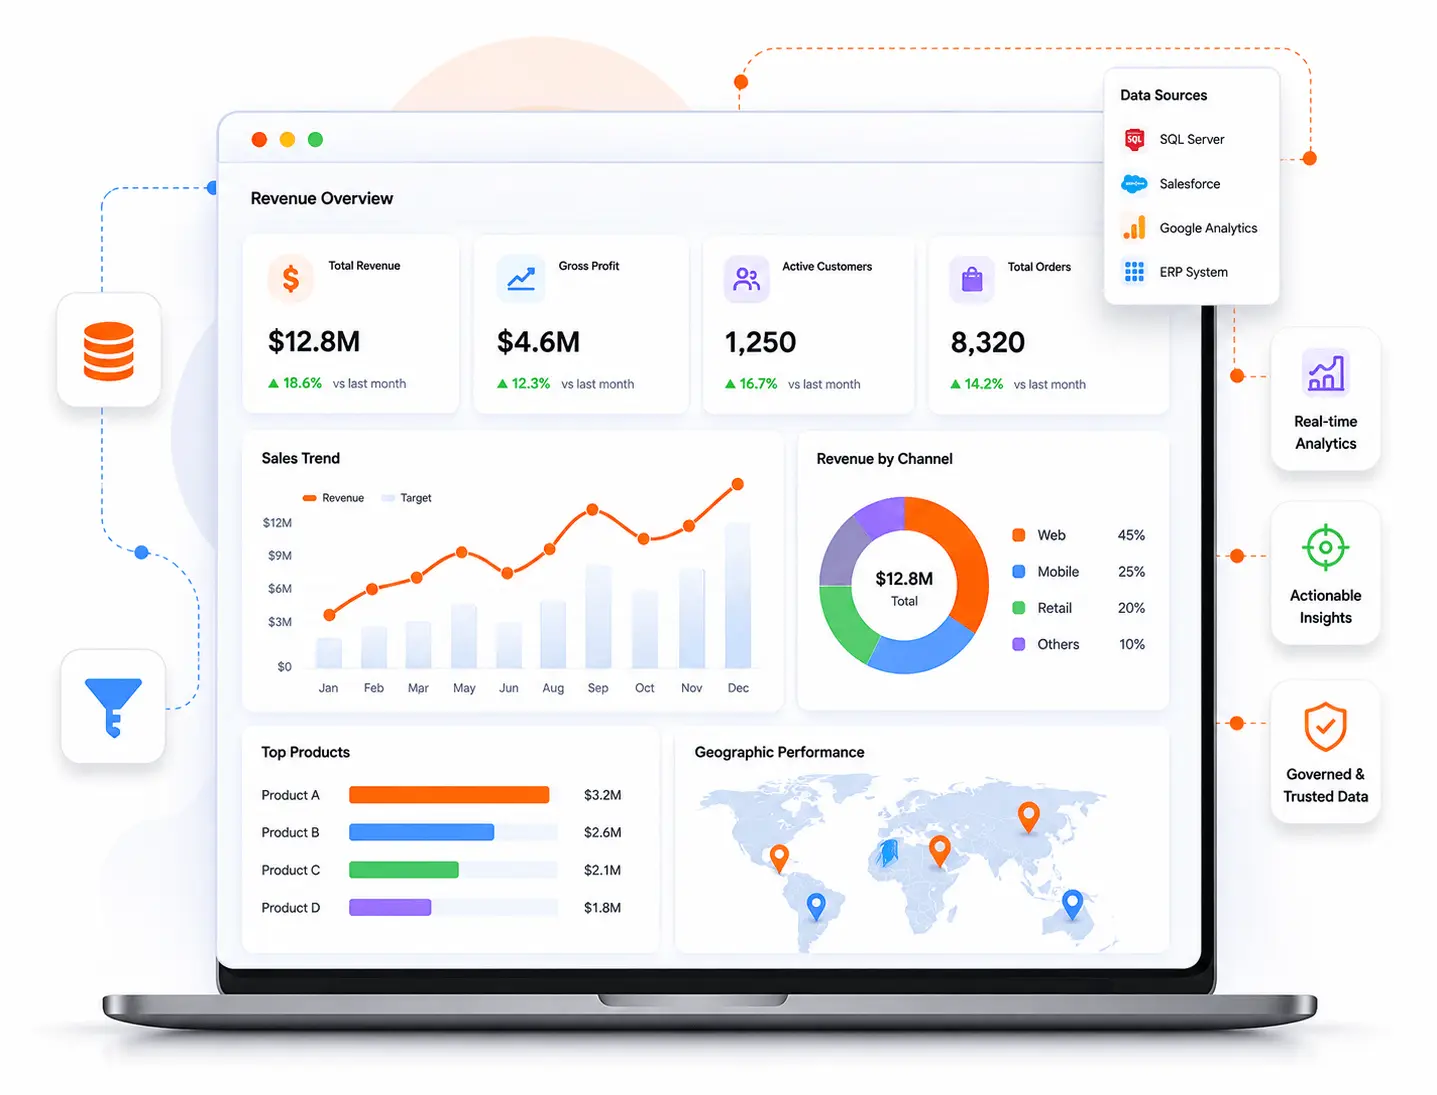
The cost of BI services depends on the number of data sources to be integrated, the complexity of data transformations required, the number of dashboards and reporting views, and whether the engagement involves a one-time build or ongoing analytics support. A single executive dashboard connected to two or three well-structured sources carries a different investment profile than an enterprise-wide reporting platform spanning multiple departments with real-time pipelines and data quality remediation.
Key Factors Influencing Total Investment

Existing Data Infrastructure
The quality and maturity of current data systems directly influence implementation complexity and scalability.

Data Source Readiness
Well-structured and accessible data sources reduce transformation effort and integration overhead.

Reporting Objectives
Dashboard complexity and business reporting requirements affect analytics architecture and development scope.

User Training Requirements
The level of onboarding and analytics training required influences overall implementation investment.

Decision Support Complexity
Systems designed for strategic operational decisions require deeper analytics and more structured reporting logic.

Transparent Investment Planning
Clear estimates tied to reporting goals and operational priorities help organisations plan investment with confidence.
What Our Clients Say

Feedback Summary:
Having worked with NebulaTech for close to 3 years now, Nebulatech IT has a strong team of engineers and we have built and shipped amazing solutions with them.

Abhimanyu C.
EM & Product Manager


Project:
AI-powered size recommendation engine
Our Contribution
Architected a flexible front-end framework to dynamically ingest, normalize, and visualize diverse sizing datasets.
Built multi-category virtual fitting & Product visualization with comparison.
Launched a lightweight front-end integration with existing storefronts with cross browser compatibility & responsive UI.
Tech Stack:




Feedback Summary:
I had a really good experience working with NebulaTech! The team is responsive, helpful, and always quick to get back to us whenever we need assistance. We worked with their Mobile App Development team to build our app, and the whole experience was smooth from the start. They were flexible with our needs and made the development process much easier than we expected.

Ryan C.
CEO


Project:
A Multi-sided Ecommerce App
Our Contribution
Instead of building each application as a separate system, we connected them through a shared backend so that order, inventory, delivery, and marketplace data stay consistent across the platform.
Designed a highly scalable infrastructure capable of handling high-concurrency traffic during peak shopping seasons.
Integrated Stripe Payment Gateway for Secure Transaction Processing and Google Maps APIs for Real-Time Geolocation & Location Tracking.
Tech Stack:







Feedback Summary:
NebulaTech IT has a clear business understanding and can articulate business needs into technical requirements. What truly sets Nebulatech apart is their professionalism, responsiveness, and commitment to quality.

Mayank D.
Director

Project:
A GiftCard Platform
Our Contribution
Consulted the client from the initial idea through detailed business logic, helping define the right technology stack, architecture, and infrastructure before moving into development.
Designed a modern, high-performance platform that is fast, secure, and SEO-friendly.
Engineered a scalable giftcard marketplace platform supporting 500+ brands across 20+ categories, with a robust transaction and payment architecture, real-time discount and pricing logic, and a seamless end-to-end purchase experience.
Tech Stack: